
Setting the right price for your product can be difficult. Setting a price too high might mean low sales, while setting a price too low could cause you to operate at a loss. Economists use a tool called the market demand curve in order to predict the demand for a product relative to price and supply.
Why the Market Demand Curve Is Important
The cost and available supply for a product have a profound effect on the demand for that product. By plotting a market demand curve for your product, you can predict the effect of price fluctuations on the demand for your product and set your price accordingly. Setting your price on the optimal point on the market demand curve means higher profits and more sales at the right price.
What Is the Market Demand Curve?
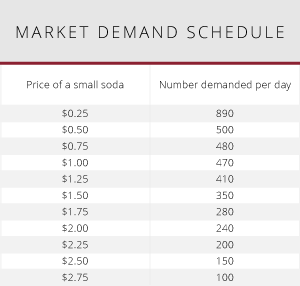
Economists and marketers use the market demand schedule to help set prices, determine how much of a given product to put on the market and make other decisions about supply and sales. The market demand schedule is a table that shows the relationship between price and demand for a given good.
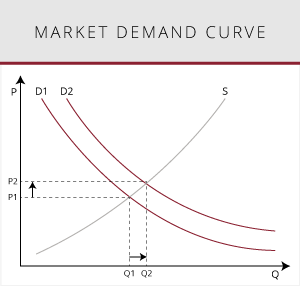
To make it easier to see the relationship, many economists plot the market demand schedule into a graph, called the market demand curve. Generally speaking, the market demand curve is a downward slope; that is, as price increases, demand decreases. The reverse of this is also true; as price decreases, demand increases. The job of someone providing a product is to find the “sweet spot” on the demand curve: the point at which price and demand are both optimal. The market demand curve can be used to find this point.
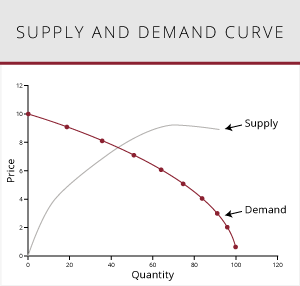
Supply also has an effect on a product’s price and market demand. When supply is short, price is driven up and demand generally increases. When supply is abundant, price comes down and demand decreases. The supply of a product can also have an effect on other, competing products; for example, if corn supply is abundant, the demand for sugar may go down as corn syrup becomes a more cost-effective replacement.
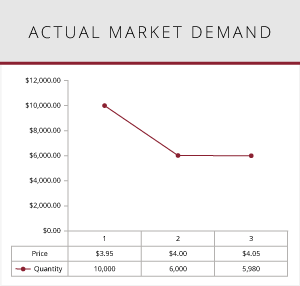
Of course, as an economic model, the market demand curve makes predictions based on all other conditions being equal. In reality, other factors can affect market demand for a product. Customer tastes change, and new information about products can affect demand. For example, if scientists suddenly discovered that saffron could cure Alzheimer’s disease, demand for saffron would likely increase independent of price and supply. Similarly, if a news story explained that a popular car model was prone to spontaneous explosion, demand for that car would decrease. Because of factors like this, the actual demand for a product is rarely as clean or as smooth as the predictive market demand curve, though the market demand curve is still a useful tool for making predictions and decisions.
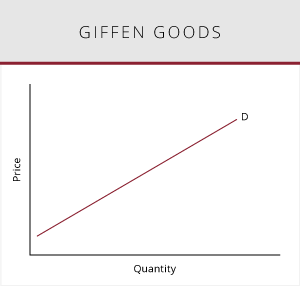
A notable exception to the typical market demand curve is a Giffen good. Giffen goods are inferior goods for which demand actually increases as price rises. Typically, this occurs for people with low income; for example, if people’s income decreases, they may buy more cheap cans of tomato soup. If the price of the tomato soup rises, people may actually decrease spending elsewhere (such as on expensive foods like steak or shrimp) and spend the income freed up by this on more tomato soup, because it’s more cost-effective relative to other options.

A second exception to the general market demand rule is a Veblen good. The market demand curve for Veblen goods also increases as price increases but, unlike Giffen goods, Veblen goods are very expensive products. Veblen goods violate the typical market demand curve because of the effect of their high price on perceptions of quality and desirability. That is, for some products, a higher price makes the product seem more inherently desirable and prestigious to own. This effect only occurs at a certain price threshold, though; below that threshold, a Veblen good behaves like a normal good. For example, if a new smartphone is introduced to the market with a high price, the manufacturers may be able to increase the price of that phone and sell more of them, because of a perception of rarity and prestige. If they had introduced the phone with a much lower price, this effect might not occur because of a perception of inferiority.
Becoming a Business Leader
Predicting market demand is just one of many important skills you’ll need to become a leader in business. With an online BBA or online MBA degree from Campbellsville University, you can learn those skills. Study in a flexible, dynamic environment with a schedule that works for your life.
